
|
| Email Home Page |
|
|

|
| Email Home Page |
|
|
|
On this page you will see how an amplifier's power is distributed when the speakers are connected in a tri-mode configuration.
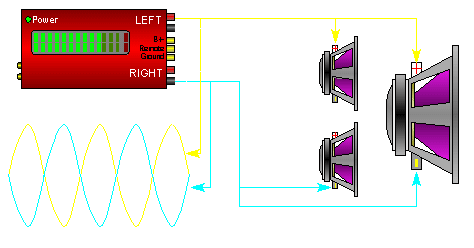
This image is a review of the signals present on each of the speaker output terminals of a bridgeable amplifier. All of the lines of the same color are connected together. You can see that the left positive output has the 'normal' signal and the right negative has the 'inverted' signal. The left negative and the right positive are connected to a reference (ground) and have no signal on them.
 In this diagram, you can see that the voltage across the subwoofer is twice the voltage of the stereo speakers. The little 'probes' show the points where the voltage would be measured/read and the gray display shows the voltage measured by the probes above each display.
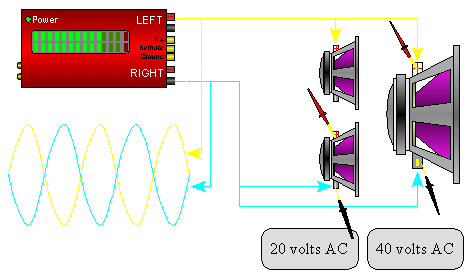
If we use the Ohm's Law formula: P=E^2/R We can see that the smaller speakers will dissipate:
P=20^2/4 The 8 ohm sub will dissipate:
P=40^2/8 The total power dissipation is 100 watts for each of the 4 ohm stereo speakers plus 200 watts into the bridged 8 ohm speaker. The total power output/dissipation is 400 watts. The same total power as if you were running the amplifier into a 4 ohm bridged OR a 2 ohm stereo load.
Tri-mode with different types of speakers: For this next example... If the passive crossover has a crossover point of 150 hertz and the crossover components are connected as follows:
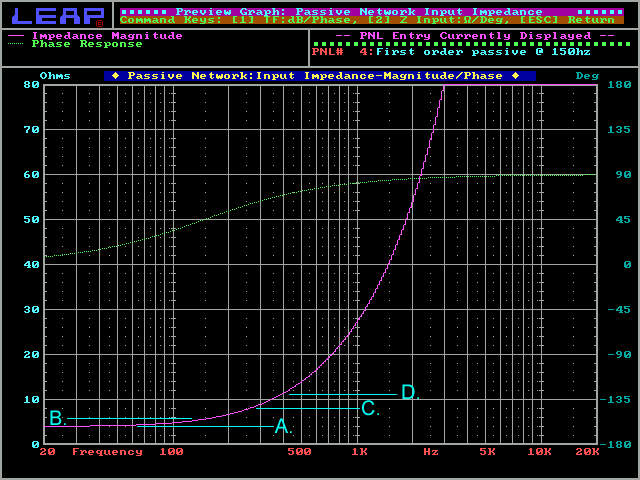
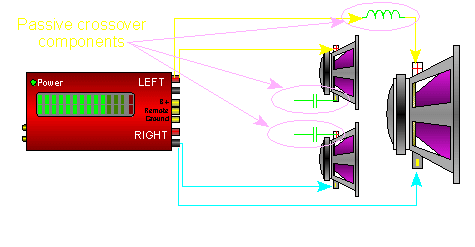 The high frequency speakers will not load the amplifier below 150 hertz and the low frequency speakers will not load the amplifier above 150 hertz. In the real world, the point where the high and low pass speakers stop being a load on the amplifier is not as abrupt as this and there is actually an overlap of frequencies where both high and low frequency drivers are a load (albeit an ever decreasing load) on the amplifier. There is no single point in the audio spectrum where both the high frequency and low frequency drivers present their rated impedance to the amplifier. On the following graph, the violet line is the effective impedance of the high frequency speakers. You can see how the impedance keeps rising.
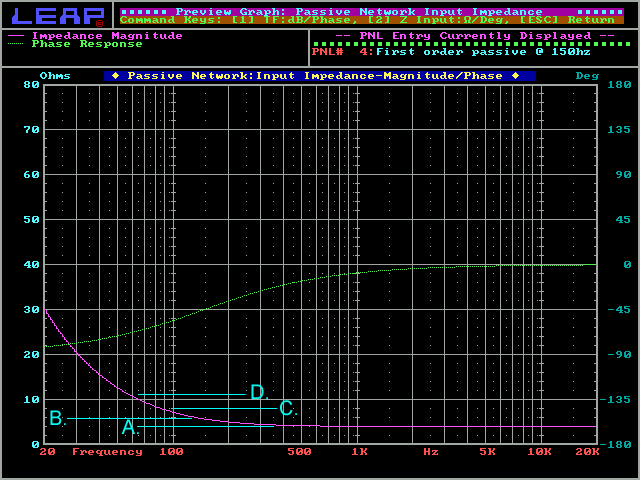
This is the impedance plot of the low frequency drivers. The description from the previous graph also applies here.
Loss of Headroom:
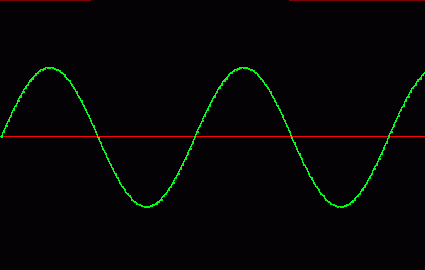 And here you can see a 2000hz sine wave.
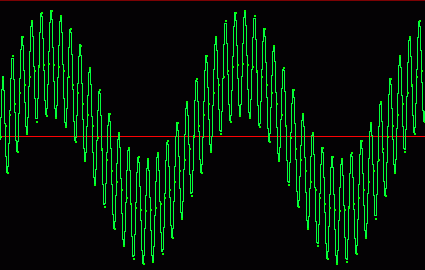
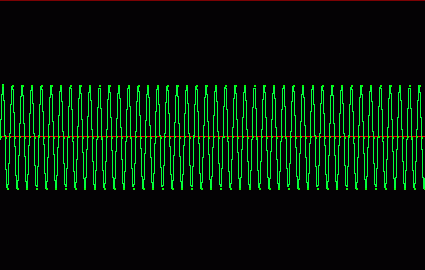 You can see (in the previous pictures) that neither of the sine waves are near the top or bottom of the window (black area). In the next picture you can see that the higher frequency is 'riding' on top of the lower frequency. When both of the frequencies are mixed together (below), you can see that they are very close to reaching the top and bottom of the window (we will consider the upper and lower borders of the window to be 'clipping'). You should also notice that the individual signals are exactly the same levels that they were before they were mixed. If the volume were only slightly increased (above the present volume setting), the amplifier would start to clip. When using an electronic crossover, the signal in third picture is separated back into the signals in the first and second pictures (if the crossover point was set approximately in the center of 100 and 2000hz).
More info on clipping:
Don't Panic!: |

|

|
|

|