|
| Email Home Page |
|
|

|
| Email Home Page |
|
|
|
The first link in the car audio chain is the head unit. The head unit most commonly contains a radio receiver and a mechanism for the playback of a recorded medium (CD/DVD, USB port...). The head unit can have speaker and/or preamp level outputs. The speaker level outputs will have enough current and voltage capacity to drive speakers. The preamp level outputs do not have the current capacity to drive speakers. They are made to drive a high impedance input of an amplifier, equalizer or electronic crossover. If the system has some part of the audio spectrum that is too loud or too low, then you may need to add an equalizer.
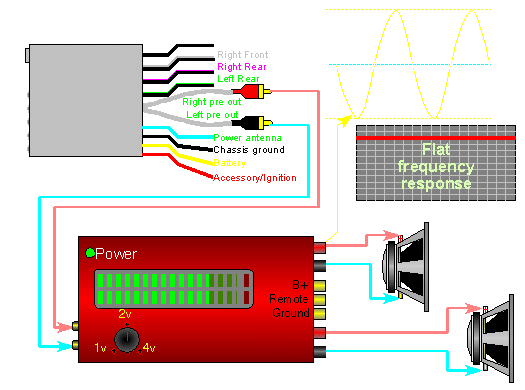
This diagram shows the head unit's RCA output jacks driving the RCA inputs of the amplifier. The signal is a full range signal which, as you can see, is reflected in the frequency response graph. It shows that all of the frequencies across the audio spectrum are being reproduced at the same level. The relative signal levels of the head unit's output and the amplifier's output are shown by the sine waves in the upper right hand corner of the diagram. You can see that the output from the amplifier is larger in magnitude (because the amplifier amplifies the head unit's output signal). In a real system, the difference in magnitude between the two waveforms would actually be much larger than shown but you get the picture (or the diagram :-).

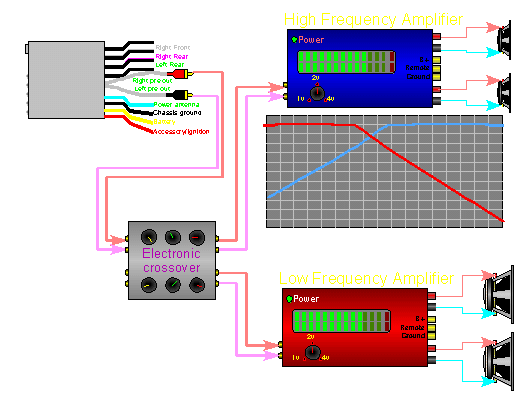
In this diagram, you see a slightly more complicated system. This system uses a 2 way electronic crossover. You can see that the full range signal from the head unit is divided into high and low frequencies. The high frequencies go to the amplifier that drives the mid and high frequency speakers (let's pretend that the speakers shown are coaxials). The low frequencies go to the amplifier that drives the woofers. The two groups of frequencies are seperated to prevent the bass from damaging the smaller speakers and to filter the high frequencies from the low frequency amplifier and speakers (which would make the woofers sound like... well, you fill in the blank). The frequency response (on the graph) is color coded to each amplifier. The frequencies represented by the blue line are being sent to the blue amp. The frequencies represented by the red line are being sent to the red amp.
 |

|

|
|

|